As the passage of AB 398 has strengthened and extended California’s Cap and Trade program, we think our readers will benefit from a spotlight on the trends in the carbon credit market. We will be featuring guest articles on California’s Cap and Trade program from our friends at CaliforniaCarbon.info. CaliforniaCarbon.info is a comprehensive information service covering the Western Climate Initiative (WCI) carbon market in North America. CaliforniaCarbon.info provides emissions and price forecasts, and regular analysis of the allowance and offset market. We are excited to feature their expert analysis on California’s Cap and Trade program and the forces that impact the carbon credit market. Look for regular articles from Stillwater’s LCFS Newsletter featured at CaliforniaCarbon.info.

November 6, 2017
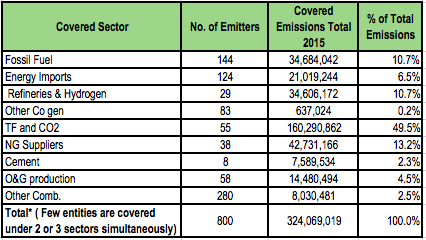
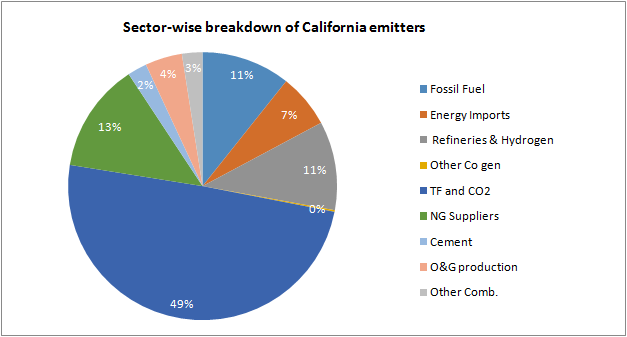
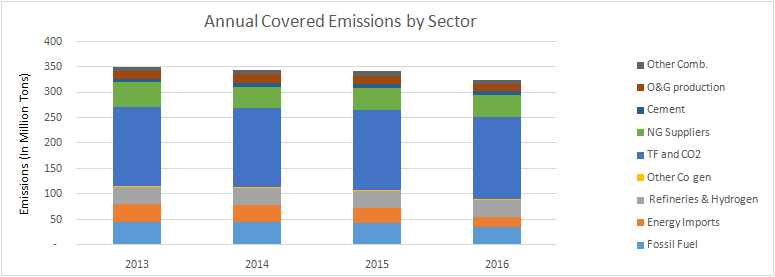
Summary: The California Air Resources Board (CARB) released the 2016 GHG facility and entity emissions data earlier today. The total 2016 emissions for the state of of California came in at 324,069,019 MMtCO2. This is an annual decline of 4.78% which is the highest year-on-year drop in emissions for the state. The data reveals that emissions reductions are much steeper than the cap which decreased last year by 3.1%. This indicates that the cap-and-trade program has proven to be effective for California, specifically in changing the sources of electricity imported into the state as well as the mix in the in-state electricity generation. As renewables take on a larger share of the energy mix, California experiences a drastic decline of higher emitting fossil fuels. These changes signify that companies are taking aggressive steps to perform well under compliance obligations set forth by CARB.
Highlights from 2016 emissions data
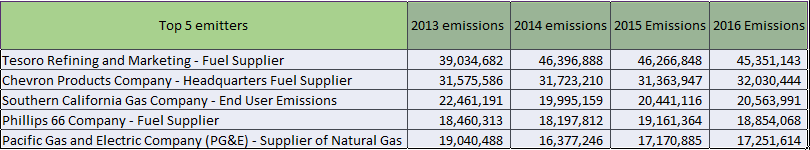
1. Emissions from transportation fuels rising – Across all the sectors, emissions from transportation fuel suppliers registered the highest annual increase – 1.1% or 1.8 MMT in absolute terms. Three other sectors saw an increase in their emissions totals: refineries at 3.6%, cement manufacturing at 1.8%, and Natural Gas, NGL & LNG suppliers at 0.2%. The increase in emissions from these sectors was generously compensated by falling emissions from other sectors under the cap; most dramatically from importers of electricity and fossil fuel electricity generators– total emissions fell approximately 31.6% (9.7 million) and 18.3% (7.7 million) respectively. Oil & Gas emissions also saw a similar fate as they declined by 12.3% (2.03 million).
2. Electricity importers correct their behavior under the cap – The decline in emissions from electricity importers can be attributed to the fact that the total electricity imported declined by 7.1% (6,576 GWh) in 2016 when compared to 2015. Out of the total electricity imported, the share of electricity from non-renewable sources such as coal and natural gas declined drastically from 29% in 2015 to just over 20% in 2016, whereas the share of electricity imported from renewable source increased from 17% of the total electricity imported in 2015 to 20% in 2016.
3. In-state generation tones down on non-renewables – Similarly, emissions from fossil fuel electricity generators declined because in-state electricity generation from non-renewable declined from 118,028 GWh in 2015 to 99,155 GWh in 2016. Whereas, contribution of renewable source of in-state electricity generation increased from 48,005 GWh in 2015 to 55,300 GWh in 2016.
What this means for the Cap and Trade market?
An annual decline in emissions by 4.7% (16.25MMT) is steeper than a 3.1% (12.1 MMT) decline in cap over the same period. As a result of an immediate drop in emissions, fewer compliance instruments will be needed to meet the obligations for 2016. We estimate that 60.7 million unused allowances will be carried over to the next compliance year i.e. 2017.
CaliforniaCarbon.info will be publishing a comprehensive emissions report next week with more detailed sectoral analysis, followed by a review webinar in the near future. Stay tuned for updates.
Total Covered Emissions (MtCO2): 324,069,019 (2015: 340,323,495)
Reported Emitters: 800 (2015: 805)
2016 Allowance Cap: 382.4 MMtCO2 (excl. APCR: 367.1 MMtCO2)
Key Statistics